Simple Aggregations
![]() Portal allows you to dive into your data and give you vision to how your system is operating. By aggregating and transforming your data, you’re able to recognize system strengths, identify system improvement, and summarize performance.
Portal allows you to dive into your data and give you vision to how your system is operating. By aggregating and transforming your data, you’re able to recognize system strengths, identify system improvement, and summarize performance.
Query Time Intervals
Navigate to the query tab in the edit panel settings, (For reference, please see the Time Series post on how to navigate there.), select your query time interval in the GROUP BY section, and alter the time period for your aggregation.
Next, choose the type of aggregate you want to apply to the data.
Representations
- In the edit panel window, under the visualization tab, configure data best for representation. The different ways to represent the data can be as a line graph, stat, gauge, bar gauge, heatmap, table, radar graph, etc.
- Examples of charts use:
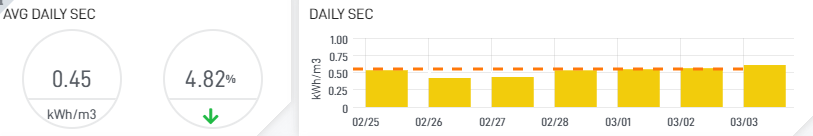
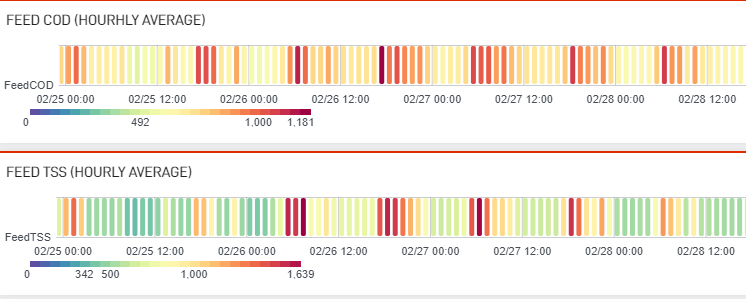
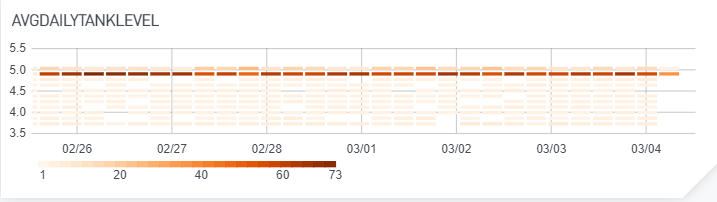
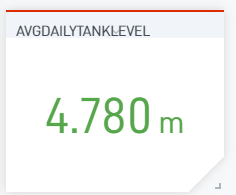
Results
- KPI Box
- Heatmap