Radar Graph
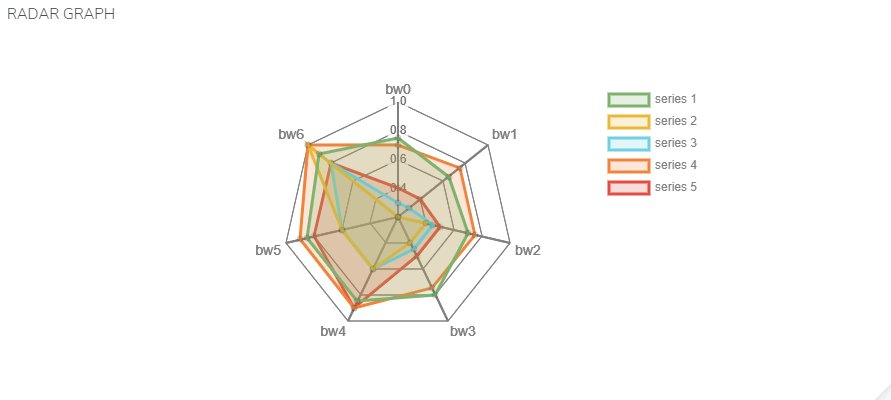
![]() Portal provides Radar Graph which helps you show multi-angle comparison between different scenarios with data.
Portal provides Radar Graph which helps you show multi-angle comparison between different scenarios with data.
Steps:
-
For a quick start, use our Sample Data Radar Graph sample.csv (382 Bytes)
to create a Radar Graph! -
Create a new panel and edit the query (Ref: Intro to Portal: Creating Time Traces - Time Series).
-
Your query should meet the following requirements to use a Radar Graph:
-
The different parameters of the radar graph may be selected as different columns in the query.
-
The columns you select must have values in the same rows to be displayed properly on the radar graph.
-
It is recommended the data you are trying to put on the radar graph is normalized/on similar scales.
-
-
Go to the visualization tab and select Radar Graph.
-
You can also edit the settings or re-name the parameters for best visualization by going to the Options tab below Visualization.
-
After setting up, make sure you name your panel properly, click apply and finally save your dashboard. Now you will see your newly added Radar Graph on your dashboard!