
EZ Correlation
![]() Portal provides EZ Correlation as a easy tool for the user to check whether the multiple variables are correlated or not.
Portal provides EZ Correlation as a easy tool for the user to check whether the multiple variables are correlated or not.
Steps:
- Create a new panel and edit the query (Ref: Intro to Portal: Creating Time Traces - Time Series)
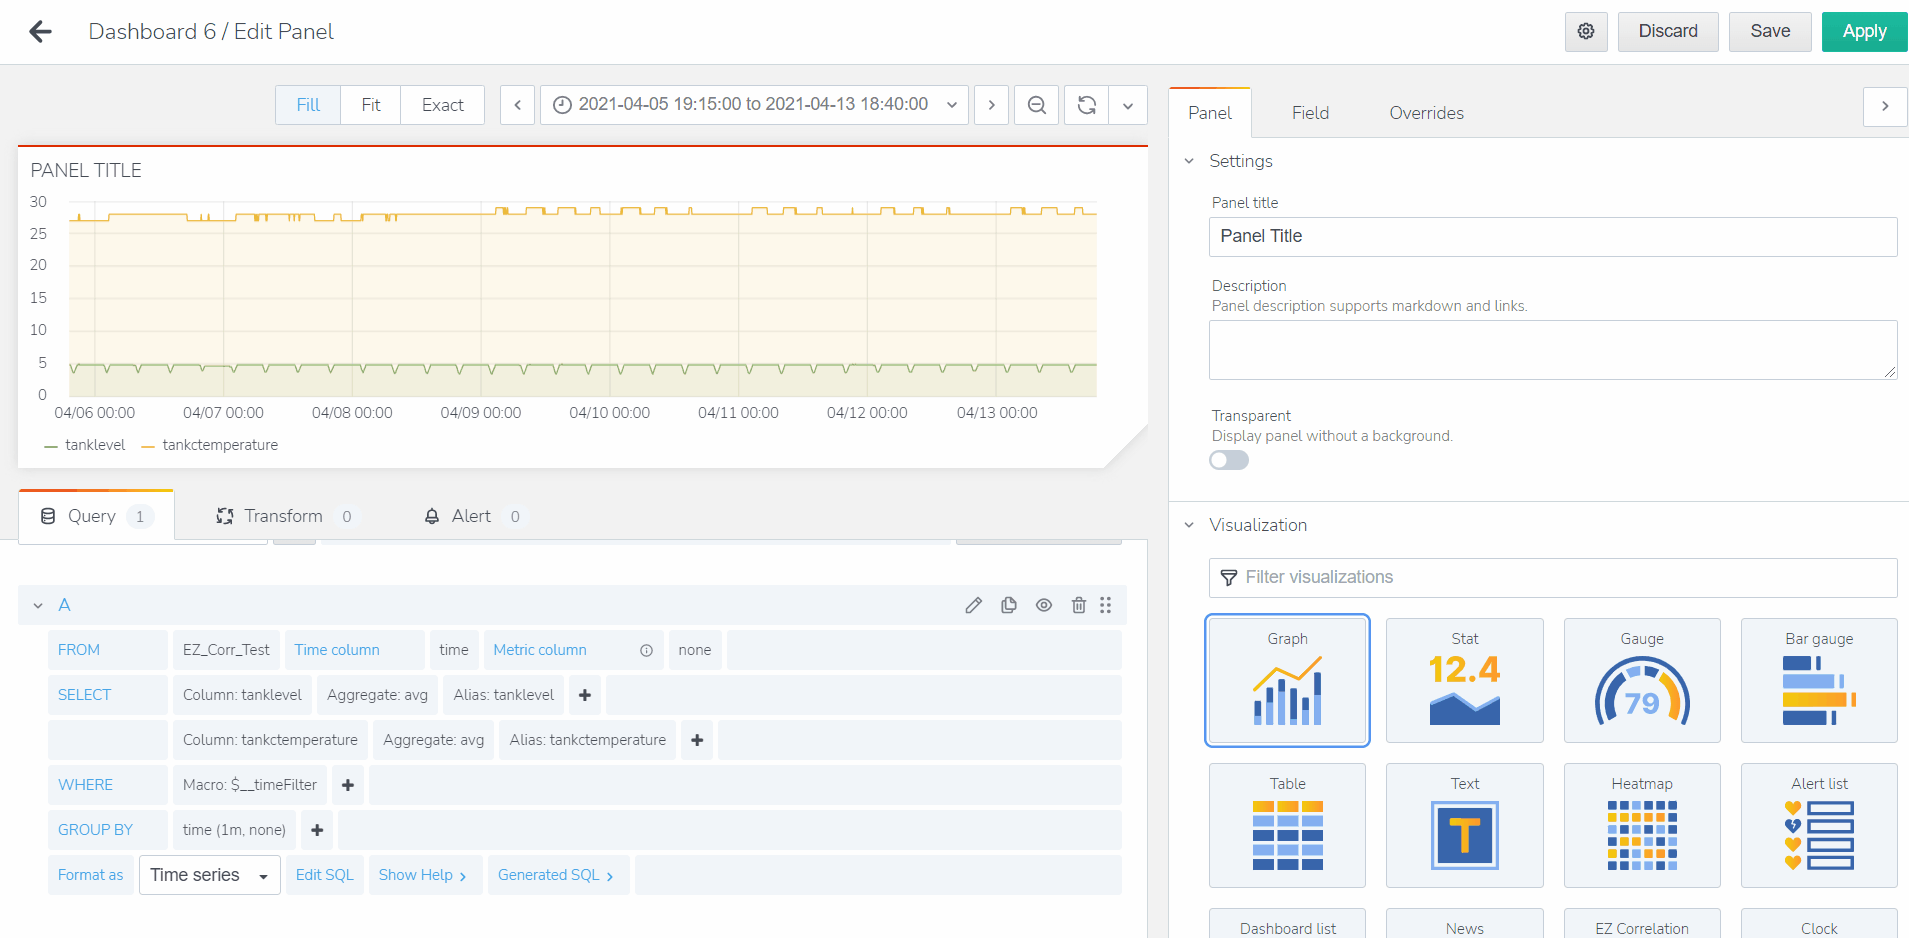
- Edit your query to get the parameters you want to check for correlation.
-
To check correlation, you would need multiple parameters in the query. So far, EZ correlation requires all the parameters within a single query.
-
After selecting the parameters, make sure your query is formatted as ‘Table’ by select ‘Table’ from the drop down list in ‘Format as’.
-
After setting up the query, go to the visualization tab on the right and select EZ Correlation.
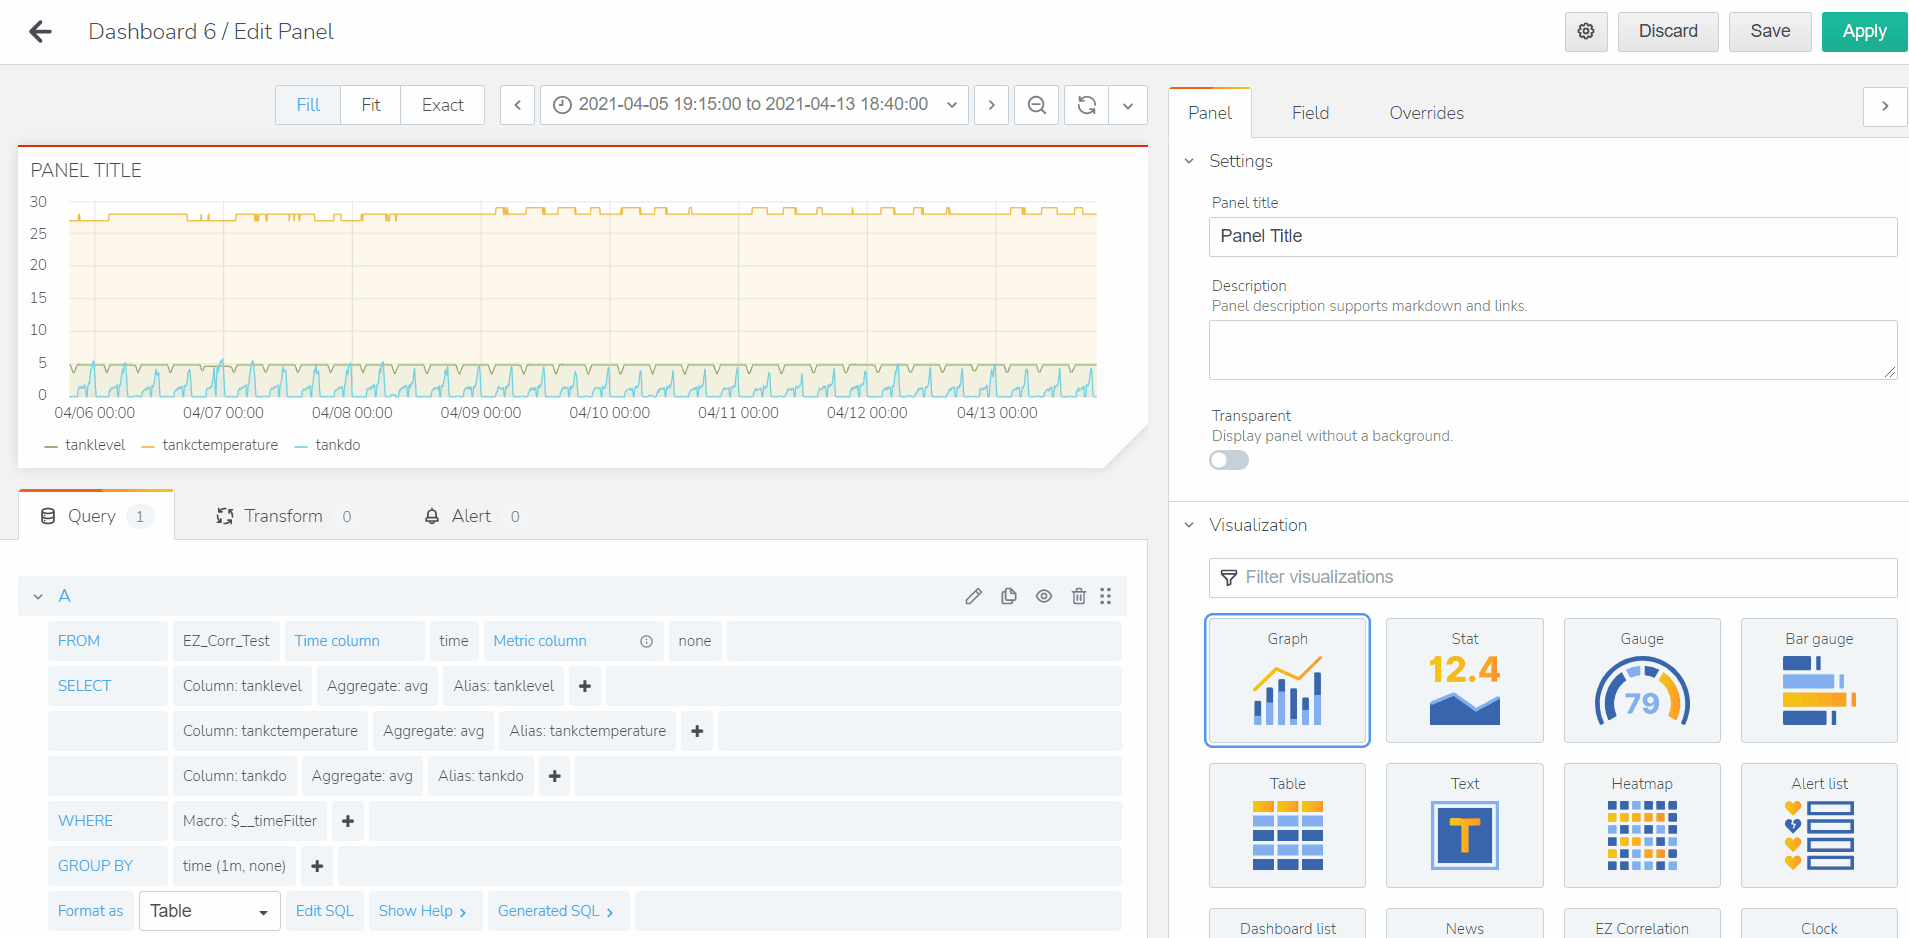
Now you can check on the correlation table. The values inside the table represent the correlation between the variable of Column name and the variable of Row name. For example, the value 0.31275 represents the correlation between ‘tankdo’ and ‘tanklevel’.
-
All the correlation values are between -1 and 1. The higher the absolute value, the more correlated the two variables are. The lower the absolute value is, the two variables are more independent from each other.
For more advanced Correlation and Covariance calculation, check out ![]() under Transform panel!
under Transform panel!