Transforms by  Assist
![]() Portal provides a set of algorithms for the user to dig one step deeper into your data via APRICOT Assist Transforms features.
Portal provides a set of algorithms for the user to dig one step deeper into your data via APRICOT Assist Transforms features.
Before you start:
- Before you can configure and set up transformations, set up the query properly so that it returns data of interest (Ref: Intro to Portal: Creating Time Traces - Time Series).
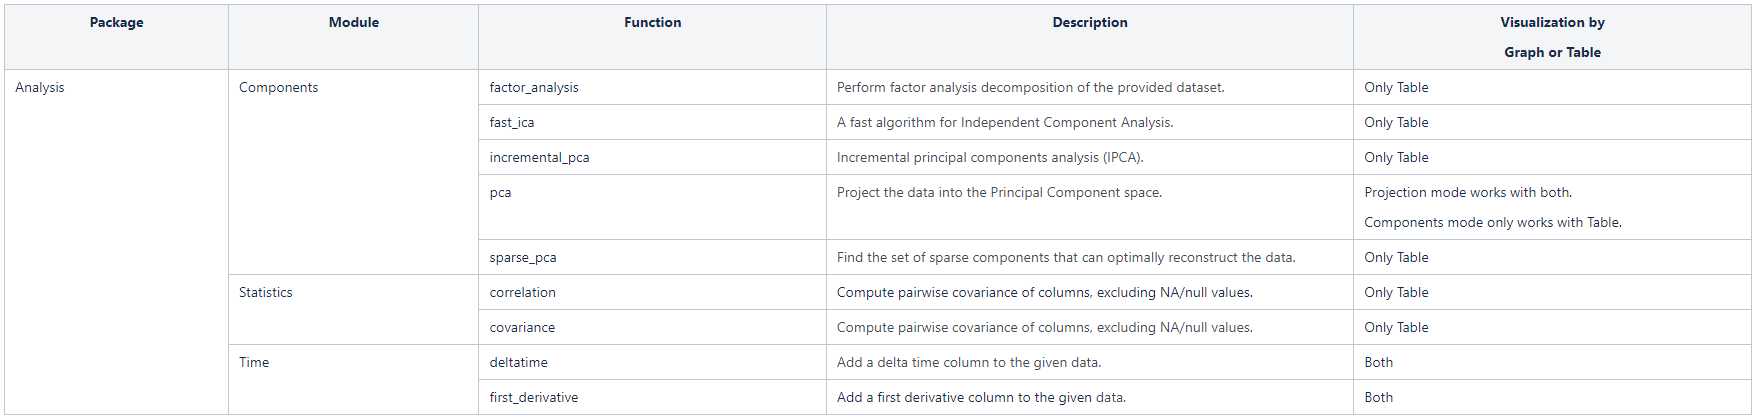
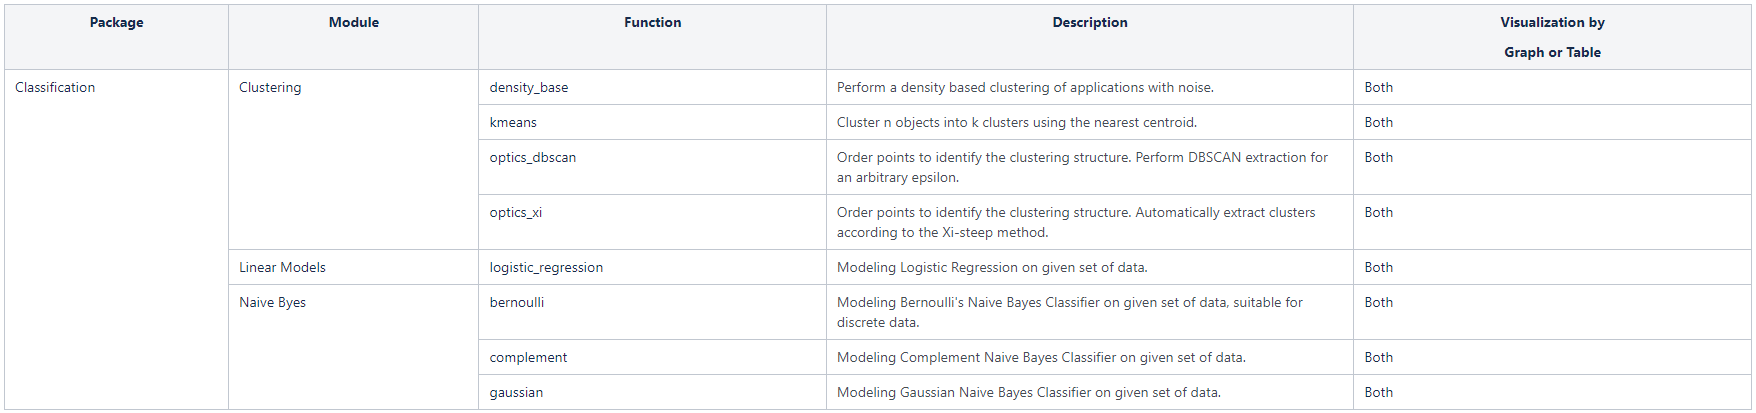
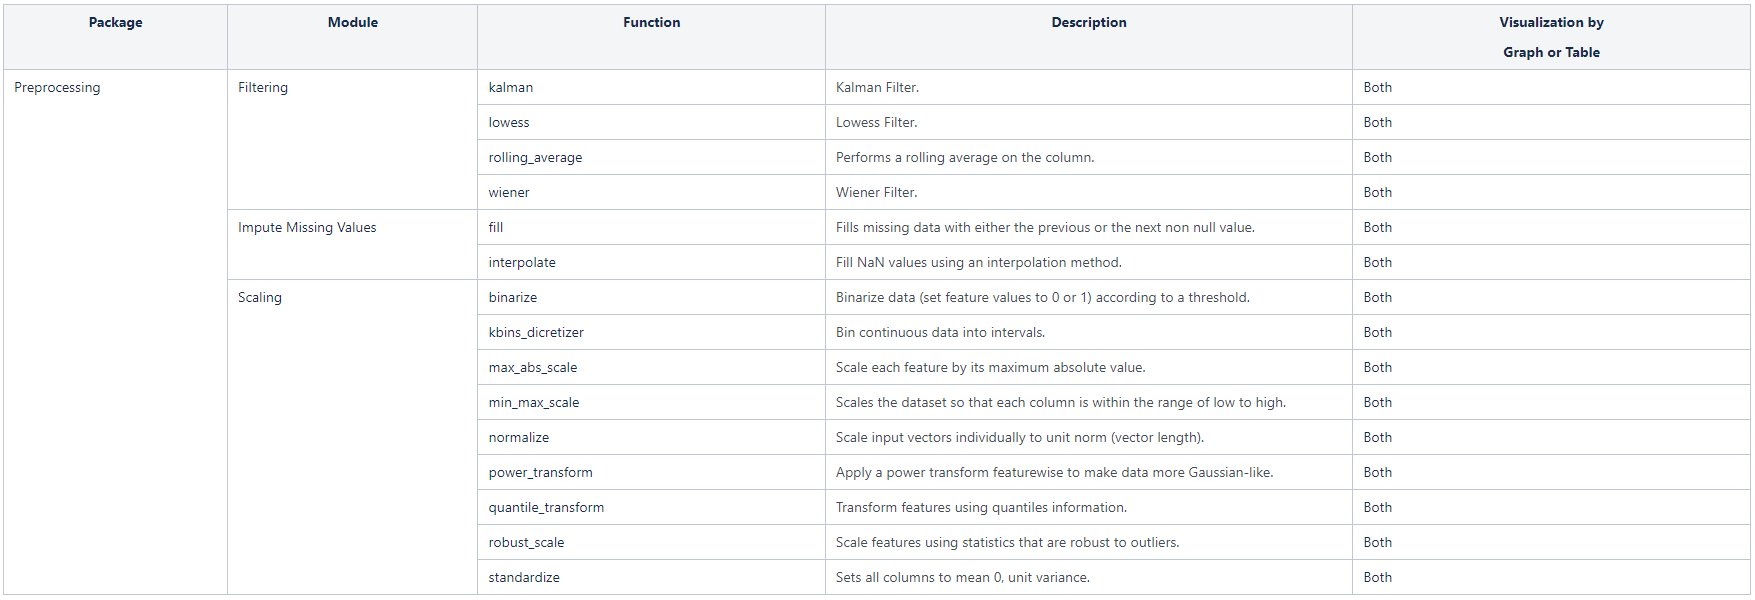
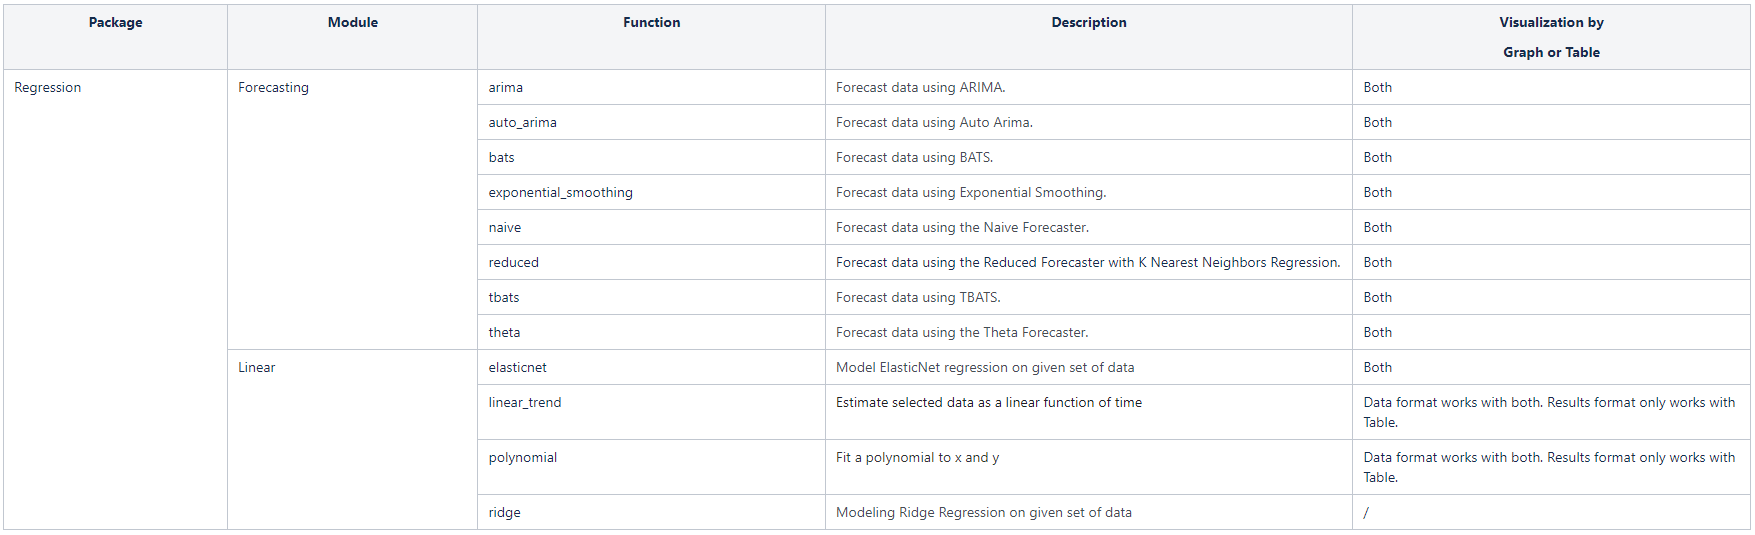
- Different tools provided in the APRICOT Assist Transforms may require different conditions regarding the query format and Visualization type. In this tutorial, we will use “Linear Regression” as an example. For other tools/algorithms, please refer to the table in the first response to this post for conditions details.
Steps to apply Linear Regression in Transforms:
-
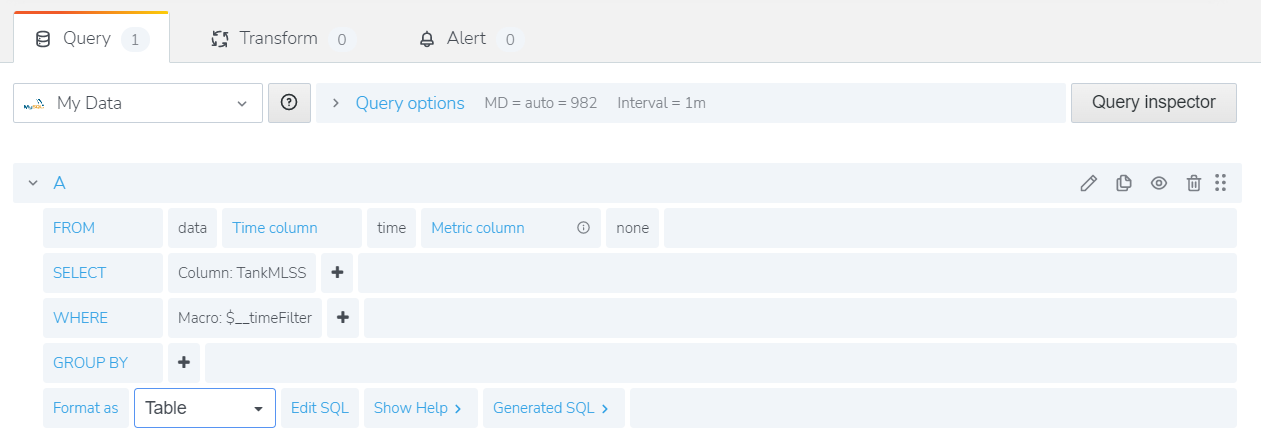
In the query window, make sure your query is formatted as “Table” in the field “Format As”.
-
Go to the Visualization tab on the right hand side, and select “Graph” or “Table”. In this example, we will use Graph. Please refer to the table at the end for the conditions for the other algorithms.
-
Now, remember the variable name in your query for the algorithm to be applied (shown as “G” in this example screenshot below). You will need this name when editing the transforms in the next few steps.
-
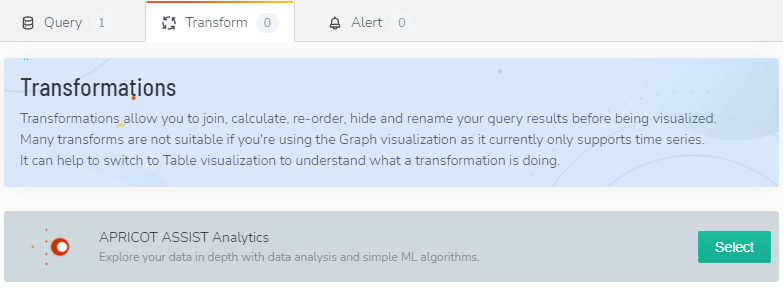
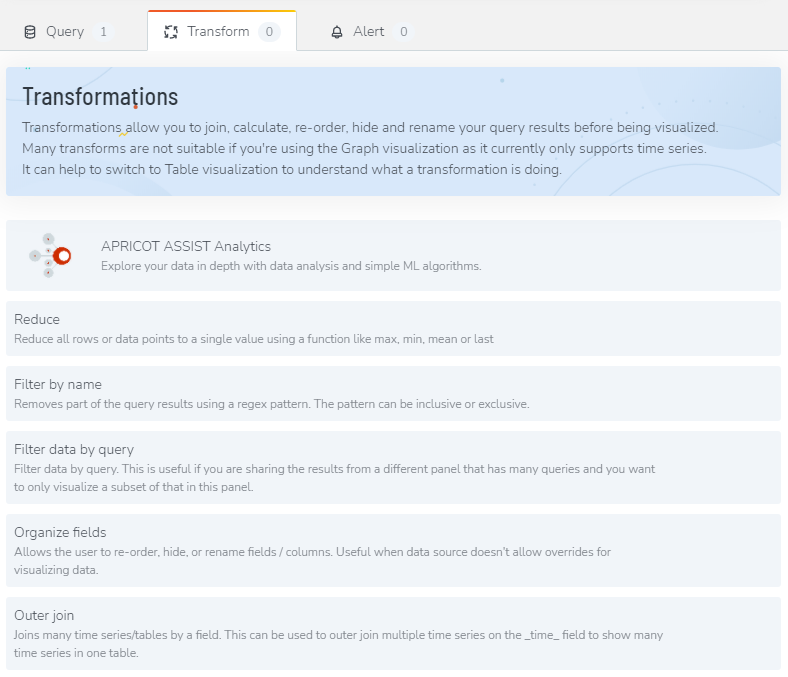
Next, navigate to the Transform tab below your chart and select “APRICOT ASSIST Analytics”.
-
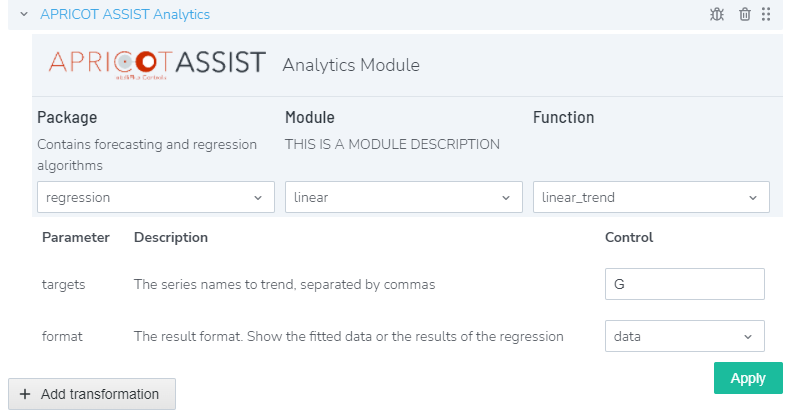
Here you can explore the different functions under modules and packages that APRICOT provides. In this example, we will choose “Linear Regression”. To locate this algorithm, we select “regression” Package, “linear” Module, and then “linear_trend” Function.
-
Now, move down and type in your targeting variable name as we mentioned in the previous step in targets’ “Control” window.
-
If you want to see the linear regression trend, select “data” in the format drop down. You can use Graph or Table visualization and should see your trended results directly. In this video, the trended results are shown as the yellow line.
-
If you want to check the linear regression function, select “result” in the format drop down. Please use Visualization “Table” to check on the results values.
-
-
Review your transform setting and then click on
 at the bottom.
 -
After setting the transform up, make sure to save your dashboard to save the effort from recreating it.