Scatter Plots
![]() Portal supports both 2D and 3D scatter plots.
Portal supports both 2D and 3D scatter plots.

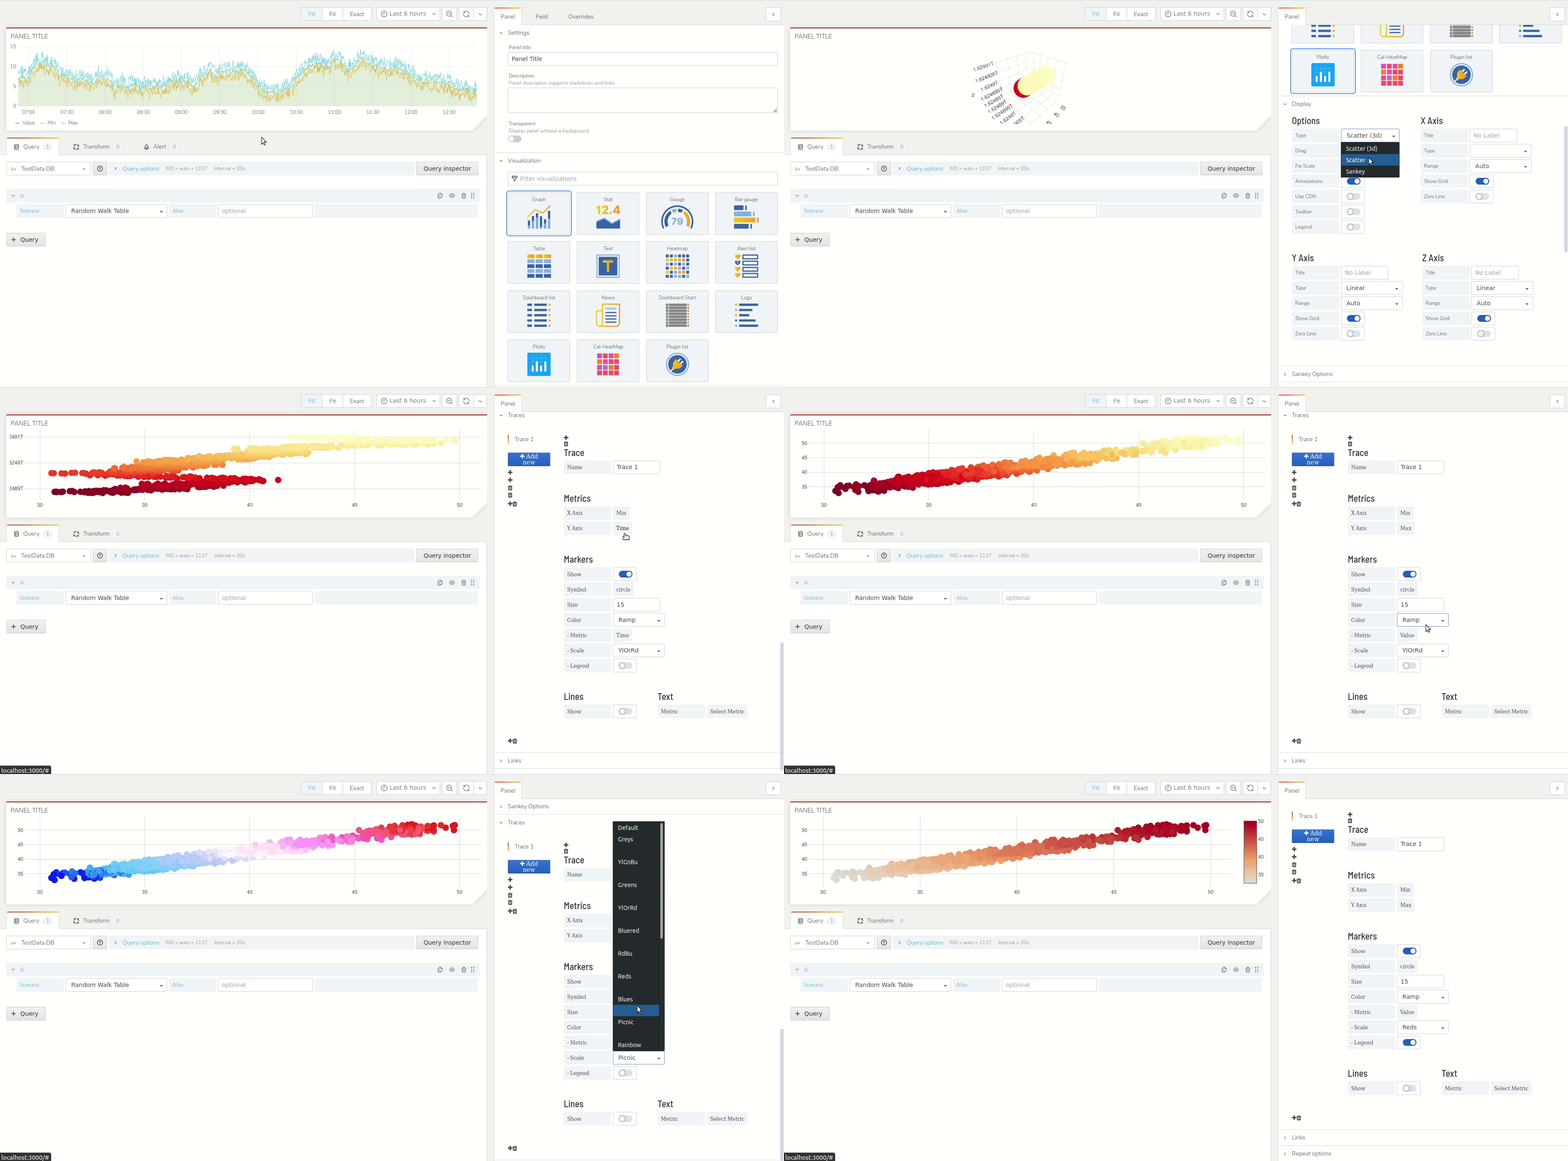
How to use the chart
- Select the ‘Plotly’ option from the Visualization section
- Select Scatter or Scatter (3D) from the Type dropdown in the Options section
- Under the Traces section, locate the Metrics options and select an X and Y variable from your query
- From the Markers options, you can choose to color the markers by the value of another variable if you wish using the Ramp color mode
