Adding annotations
![]() Portal allows you to record notes to your panels. This helps track issues, keep a record of events, and give context to your data.
Portal allows you to record notes to your panels. This helps track issues, keep a record of events, and give context to your data.
To begin, navigate to your dashboard and have a panel with data created.
(For reference, please see the Common Concepts page in the portal guide on how to create one.)
Add an annotation
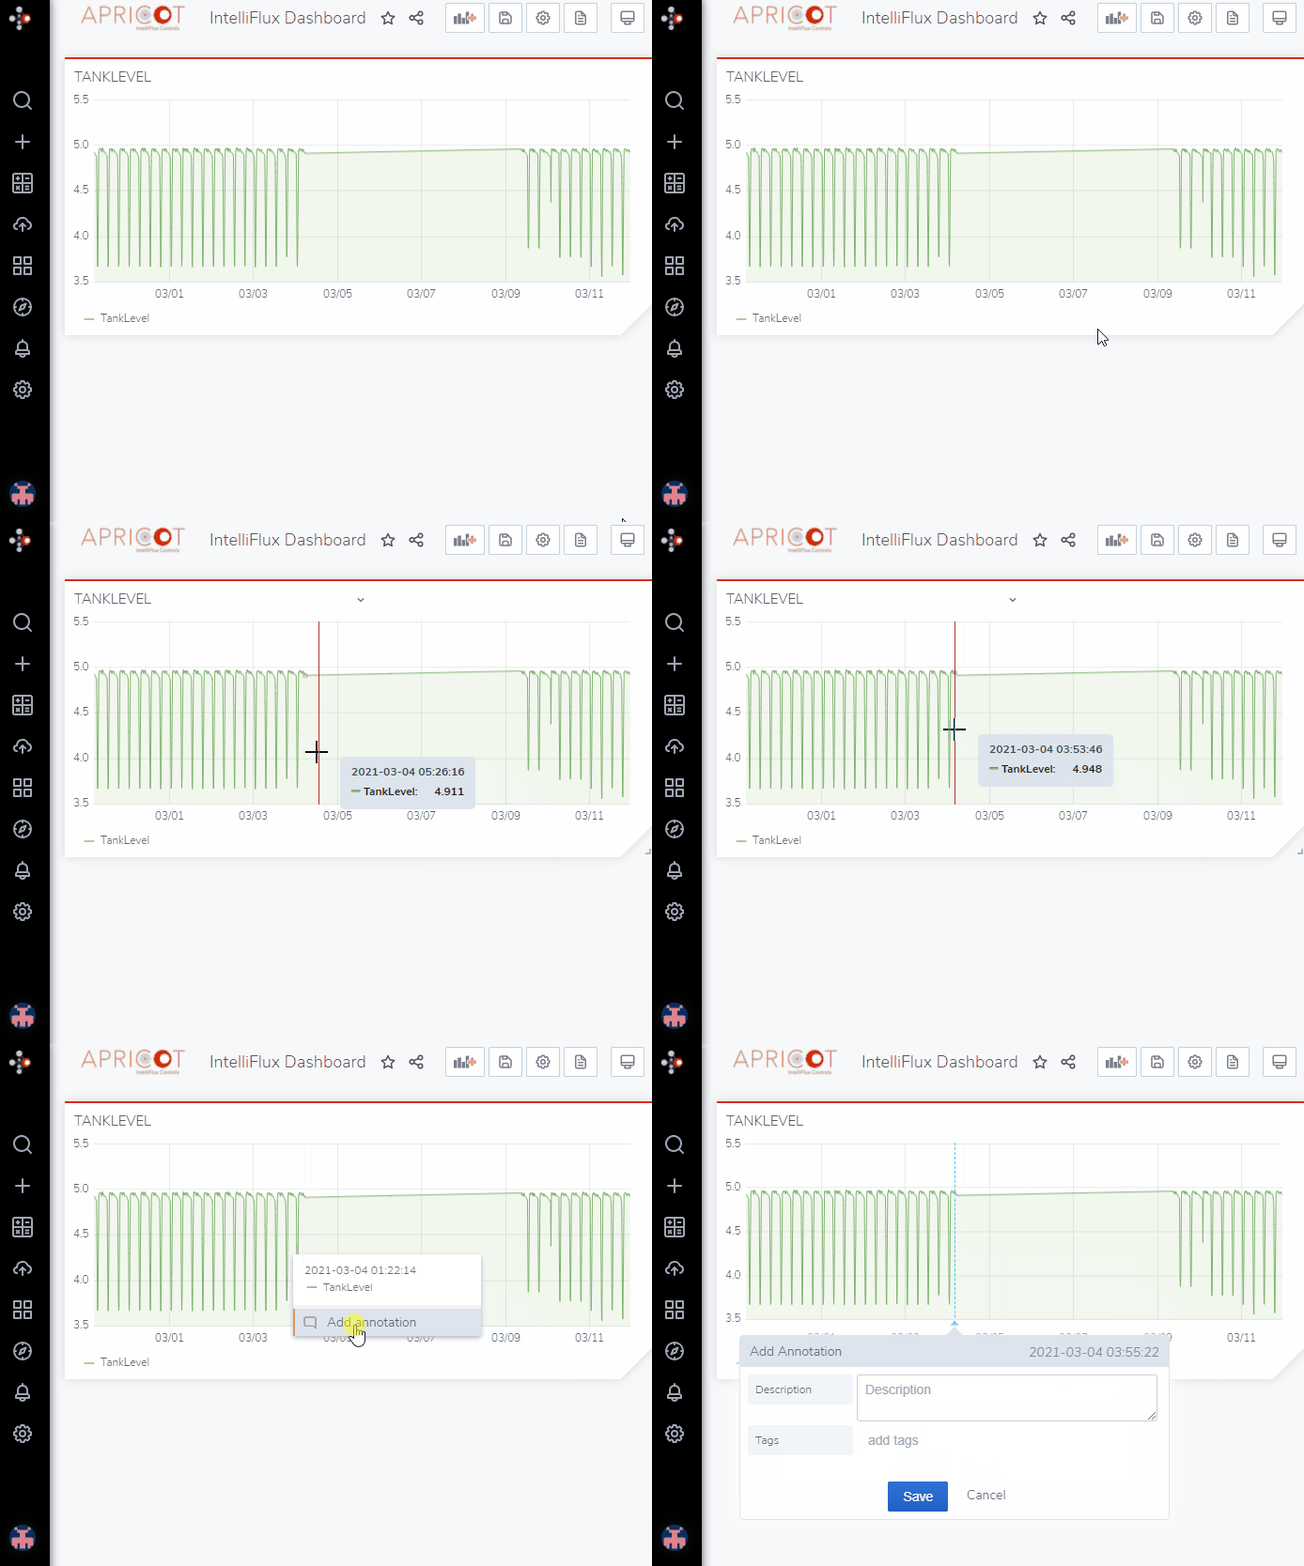
- Left-click on the graph you wish to add an annotation to. An input box should appear allowing you to add a description and tag.

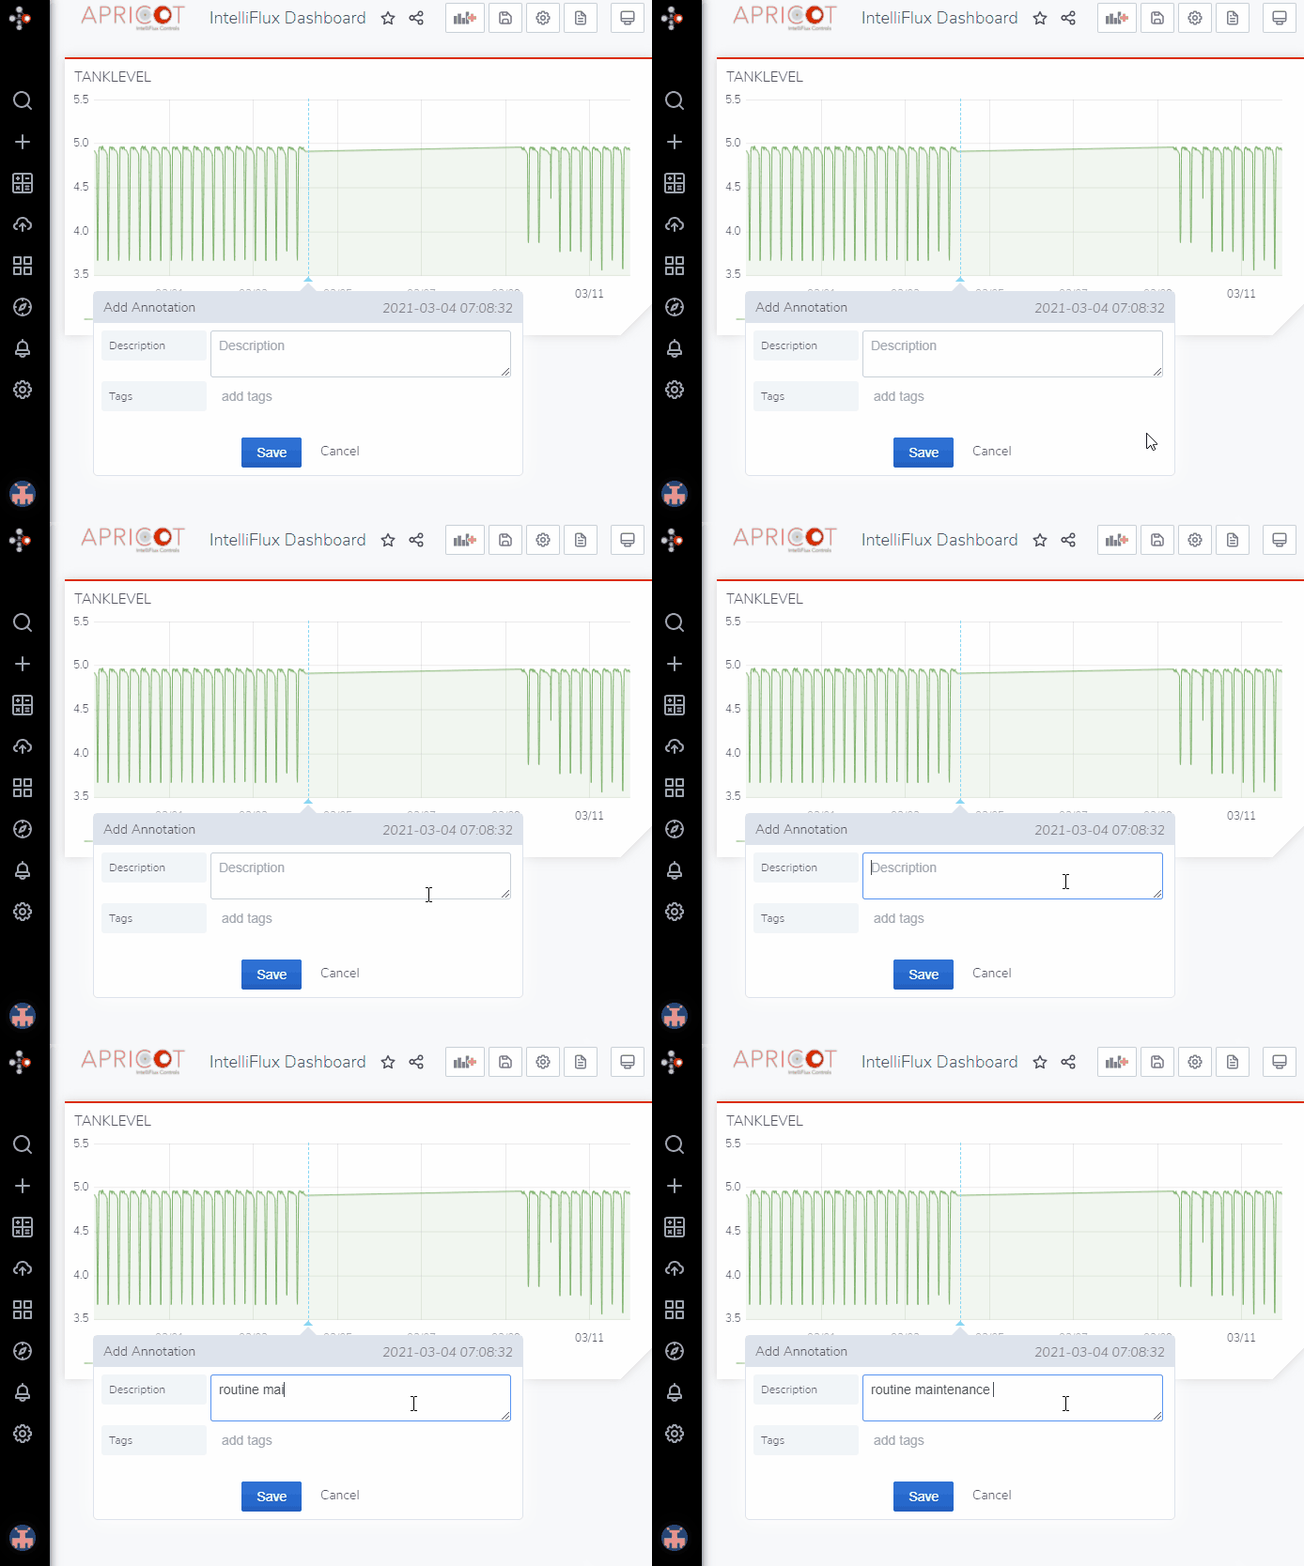
Add a description
- Input a description of the annotation and its relevance to the data.

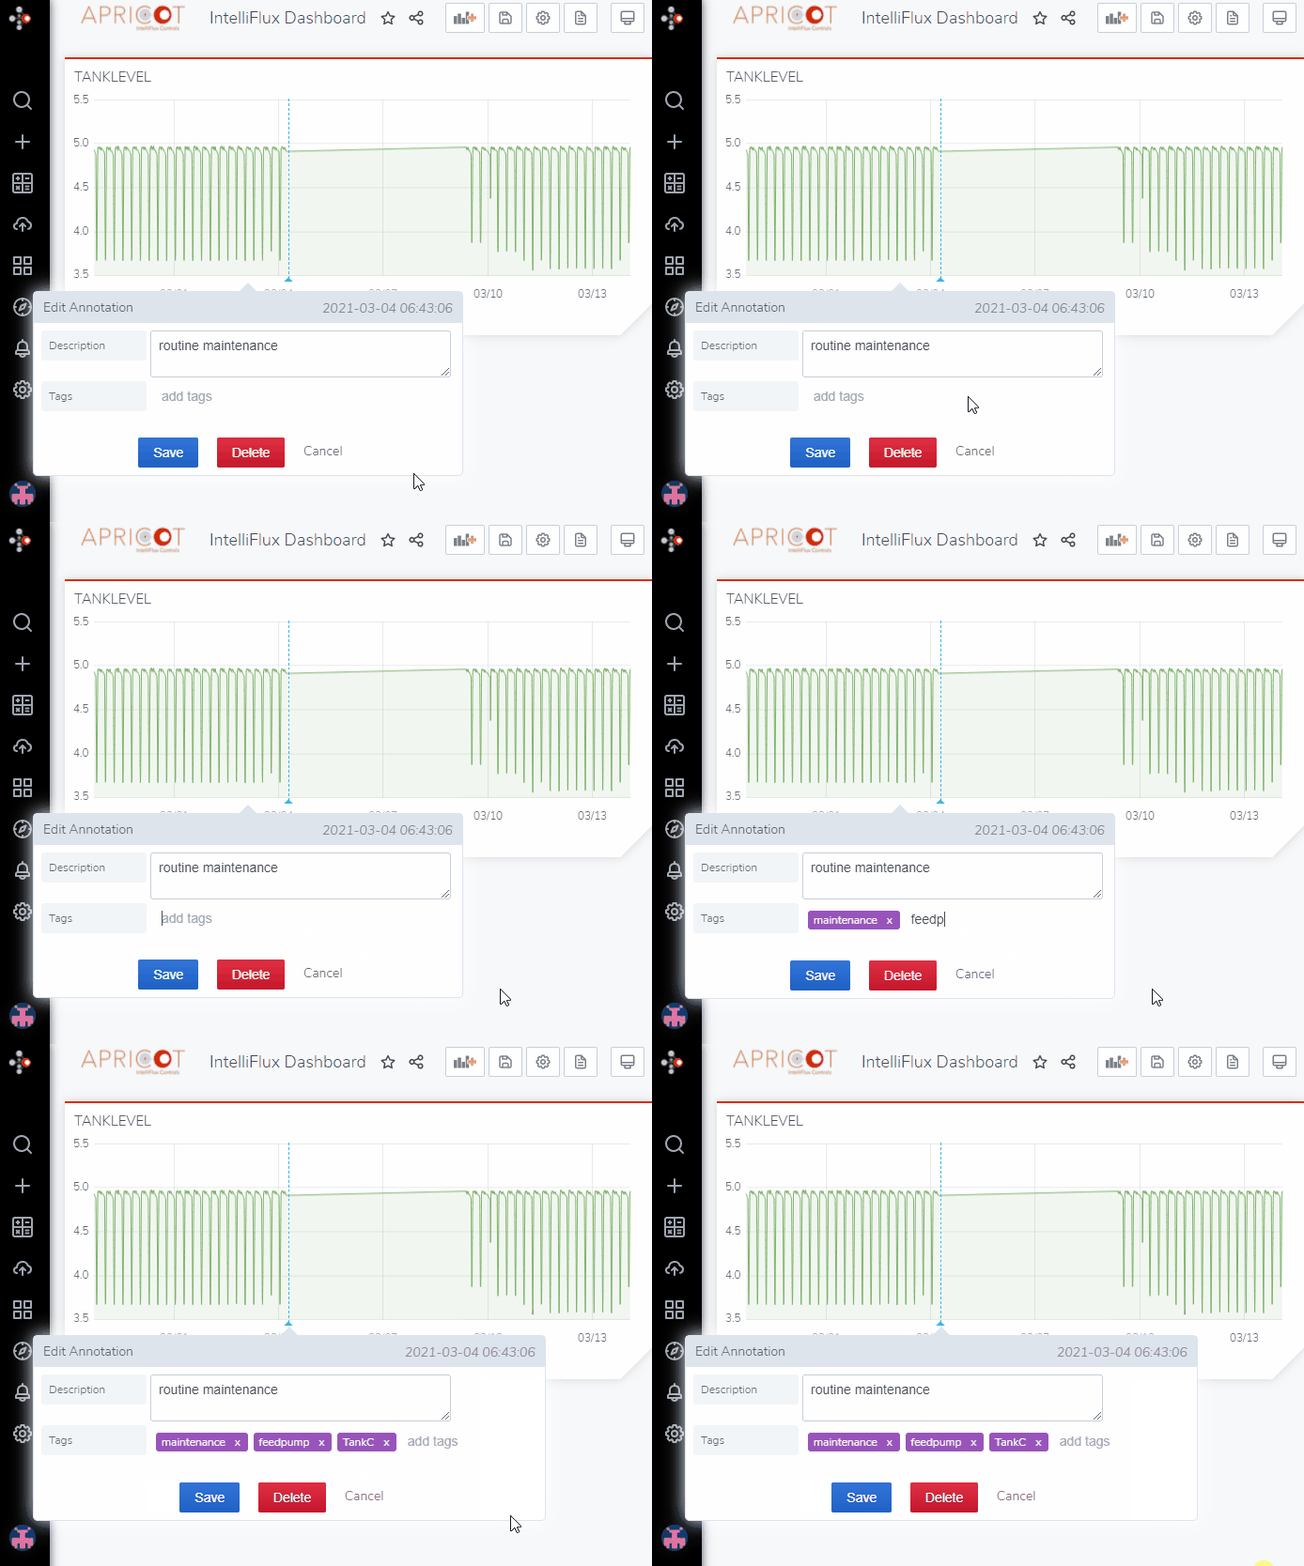
Add tags
- Add tags to your annotations. This will keep your annotations organized and correlate annotations.

Save annotation
-
Click
 to save your annotation.
 -
In the top right, a notification should appear
 that confirms your annotation was saved.
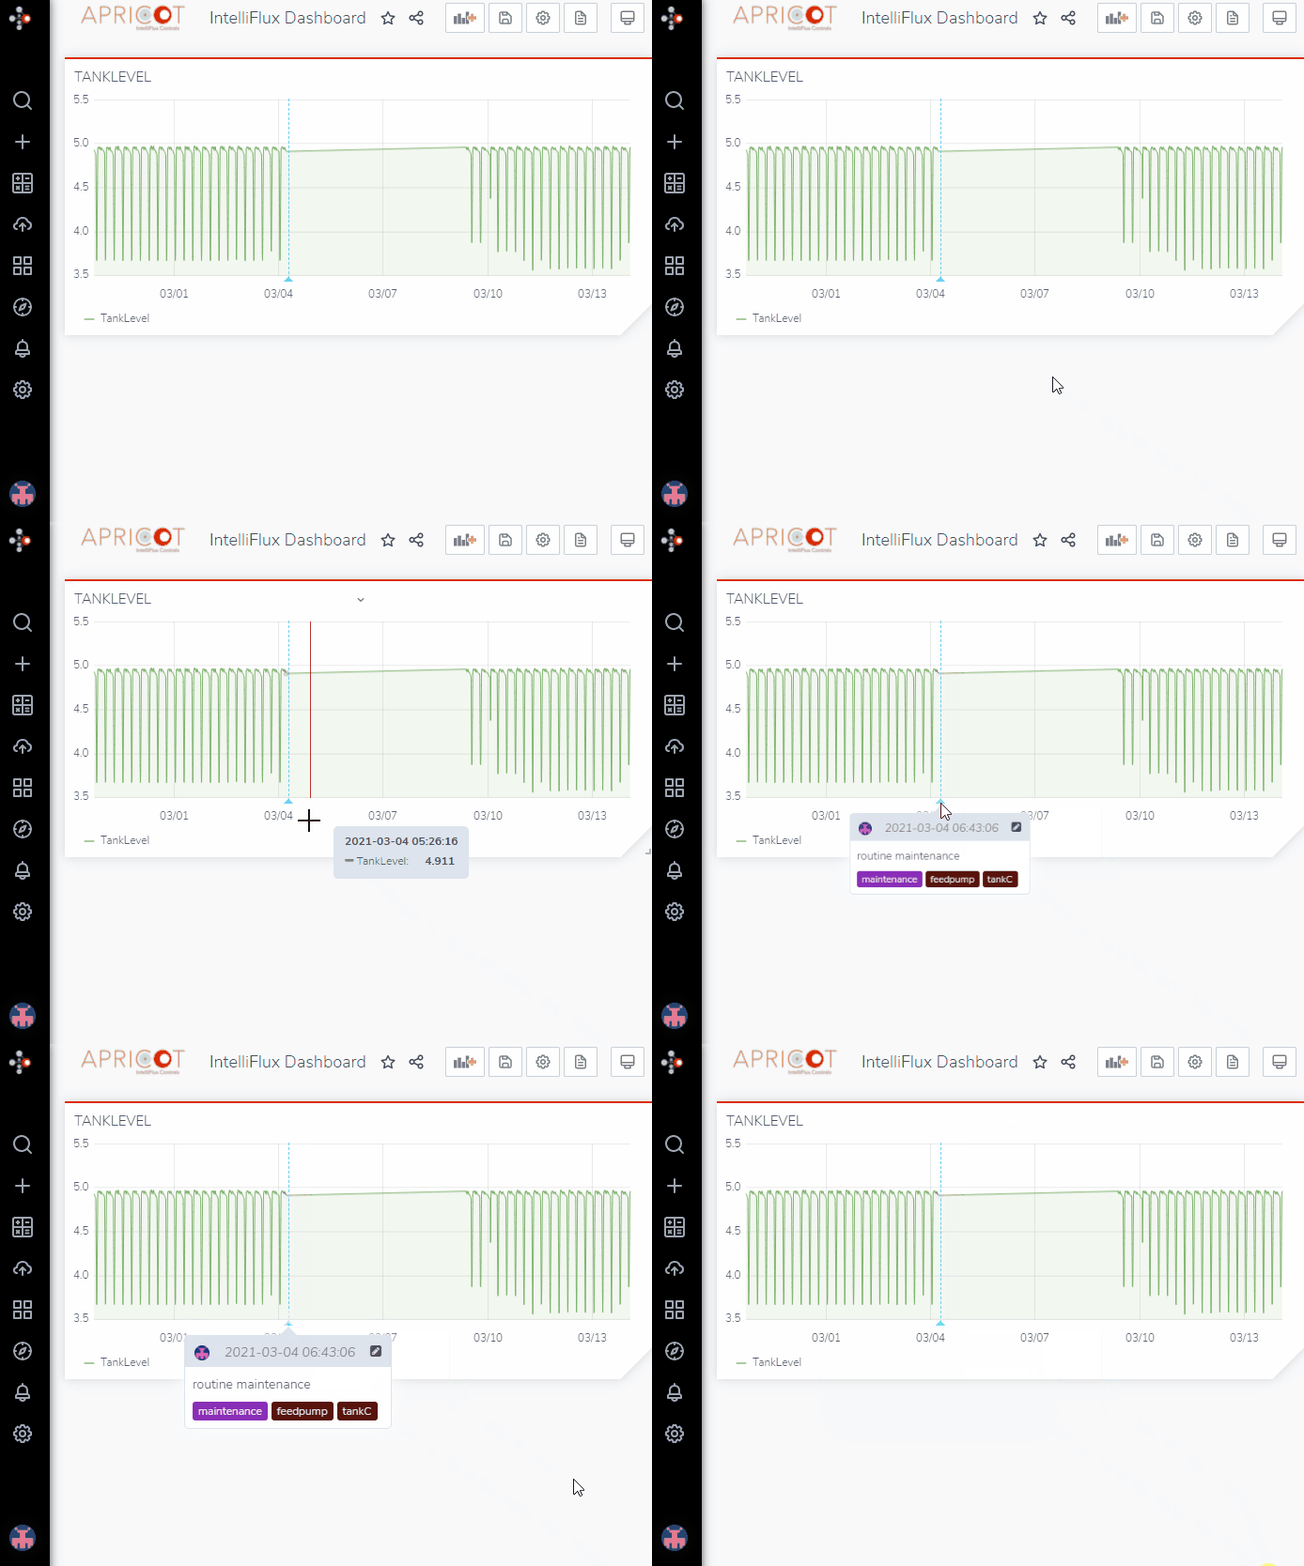
Result
- View your annotation on your panel.

