Common Concepts
In this tutorial, we’ll refer to these terms a lot, so it will help to have a good idea of what these are and how they work:
- dashboards
- panels
- queries
- visualizations
- time range
- data sources
What is a dashboard?
A dashboard gives you an at-a-glance view of your data and lets you track metrics through different visualizations.
Dashboards consist of panels, each representing a part of the story you want your dashboard to tell.
Every panel consists of a query and a visualization. The query defines what data you want to display, whereas the visualization defines how the data is displayed.
The query will only run on the data within the selected time range on the selected data source.
How to Create a Dashboard
- First, select “Dashboard” from the panel in the left portion of the screen, then click Manage This will direct you to the Dashboard Management Page.
- You can browse existing dashboard, create new dashboard, and import dashboard on this page.
- You can also create folders.
- Click the Green New Dashboard button in the top right part of the page.
- When prompt into the new dashboard page, add panels to visualize your data. Refer to How to Add/Copy/Duplicate a Panel for more information.
- Click the Save dashboard button to Rename the dashboard and save it in a select folder.
- An alternative way is to click create → dashboard from the side bar. It will direct you to the same page.

- Click the
 button to save the dashboard
Move a Dashboard
- To move a dashboard to another folder, go to the Dashboard Management Page first.
- Click the folder icon under the Manage tab to expand dashboards list.
- Select the checkbox of one or more dashboards, then click on
 icon and choose another folder from the dropdown menu.
Copy a Dashboard
- Open the dashboard you would like to copy. Click
 icon from the upper left part of the page.
 - Click Save As from the side bar.
- In the prompt window, rename the copy of the dashboard and choose the folder to save. You can also choose to copy the tags of the original dashboard. Click Save.
How to Create a Panel
- Click on the add panel button to reveal the add panel window.
- On your dashboard, you will now see the add panel window
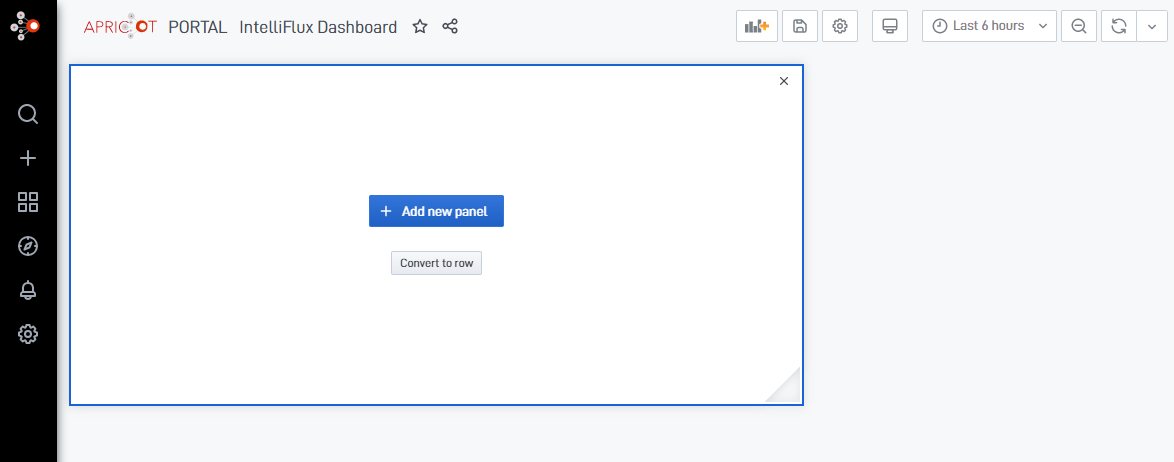
(This window will automatically display on new dashboards without any panels setup.)
- Add data to this panel by clicking the
 button.
How to Use Time Range Selection
Change the time zone and time range on the dashboard:
-
First, select the time zone: At the bottom of this drop-down window, you can see the current time zone being used. Usually the default will use your browser time setting. To change this, click on “Change time zone” to the right and select your own setting from the drop-down list.
-
After setting up the time zone, you can move on to select the time range to display your data. APRICOT provide two types of time range selection: Absolute time range, and Relative time range.
-
Absolute time range allows the user to select the time slice with specific start and end time. You can directly type in the expected start and end time under the field “From” and “To”. or you can just click on one of the fields and select the time range from the calendar shown to the left. Now, click on “Apply time range” and your dashboard will be updated based on the new time range.
-
Relative time range provides a quick path to directly check on the latest data. You can simply click on the options provided on the right under “Relative time ranges”. Notice that under this setting, your dashboard will not be updated until a certain change is applied or until it is refreshed.
-
If you want to have the same time range when opening up the same dashboard every time, make sure you check the option “Save current time range as dashboard default” when saving the dashboard.
Set a Live Dashboard
-
You can also set up a live dashboard which keep updating automatically. To do this, first make sure your time range is set to be a relative time range, so that the new data when updated will be displayed.
-
Next, click the down arrow button to the right.
-
Next, select the frequency you would like the dashboard to update at.
-
Now your dashboard will always catch up with the latest data!