
This is an example dashboard utilizing Aggregate function, Linear regression, EZ correlation and more.
Click here to checkout the dashboard! Feel free to explore more by changing the time range and checking a shorter period of time (e.g., the last 5 years).
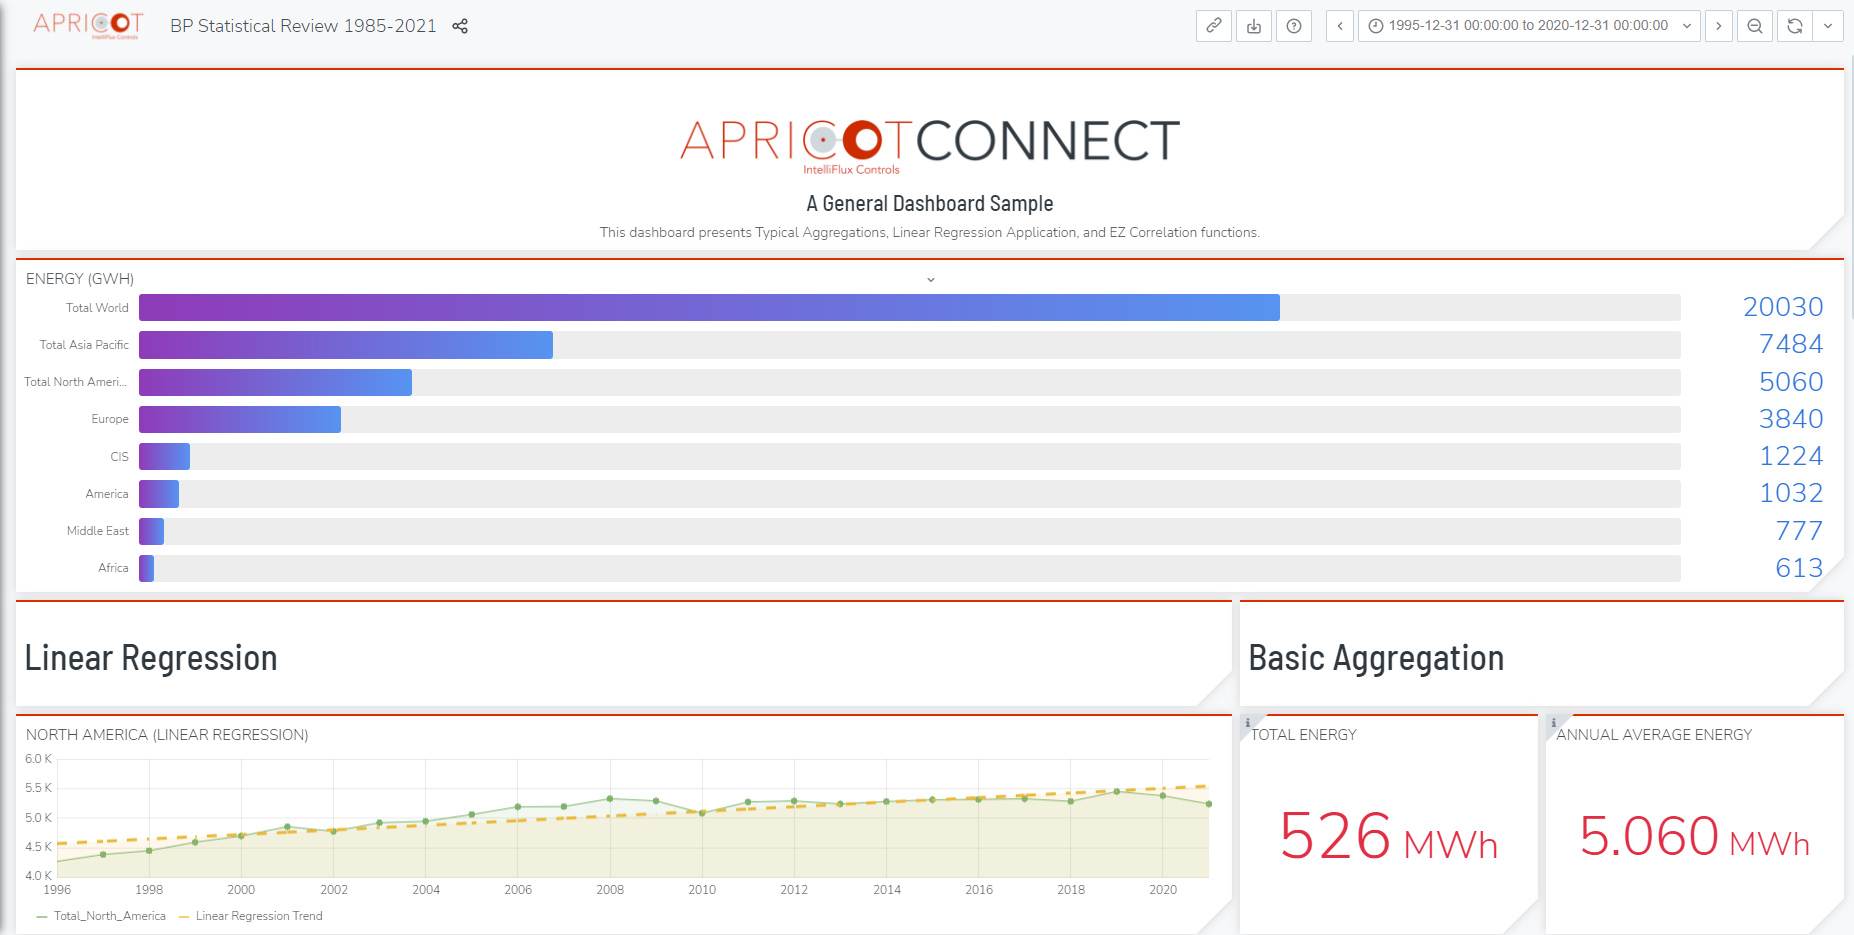
Highlight in the dashboard:
- The first panel shows a summary information of different areas and regions.
- The Linear Regression on the left shows the North America power consumption per year with the fitted linear regression trend on the same panel.
- By applying basic aggregation function, statistics of the data, such as the total and average, can be calculated and presented for the regions of interest.
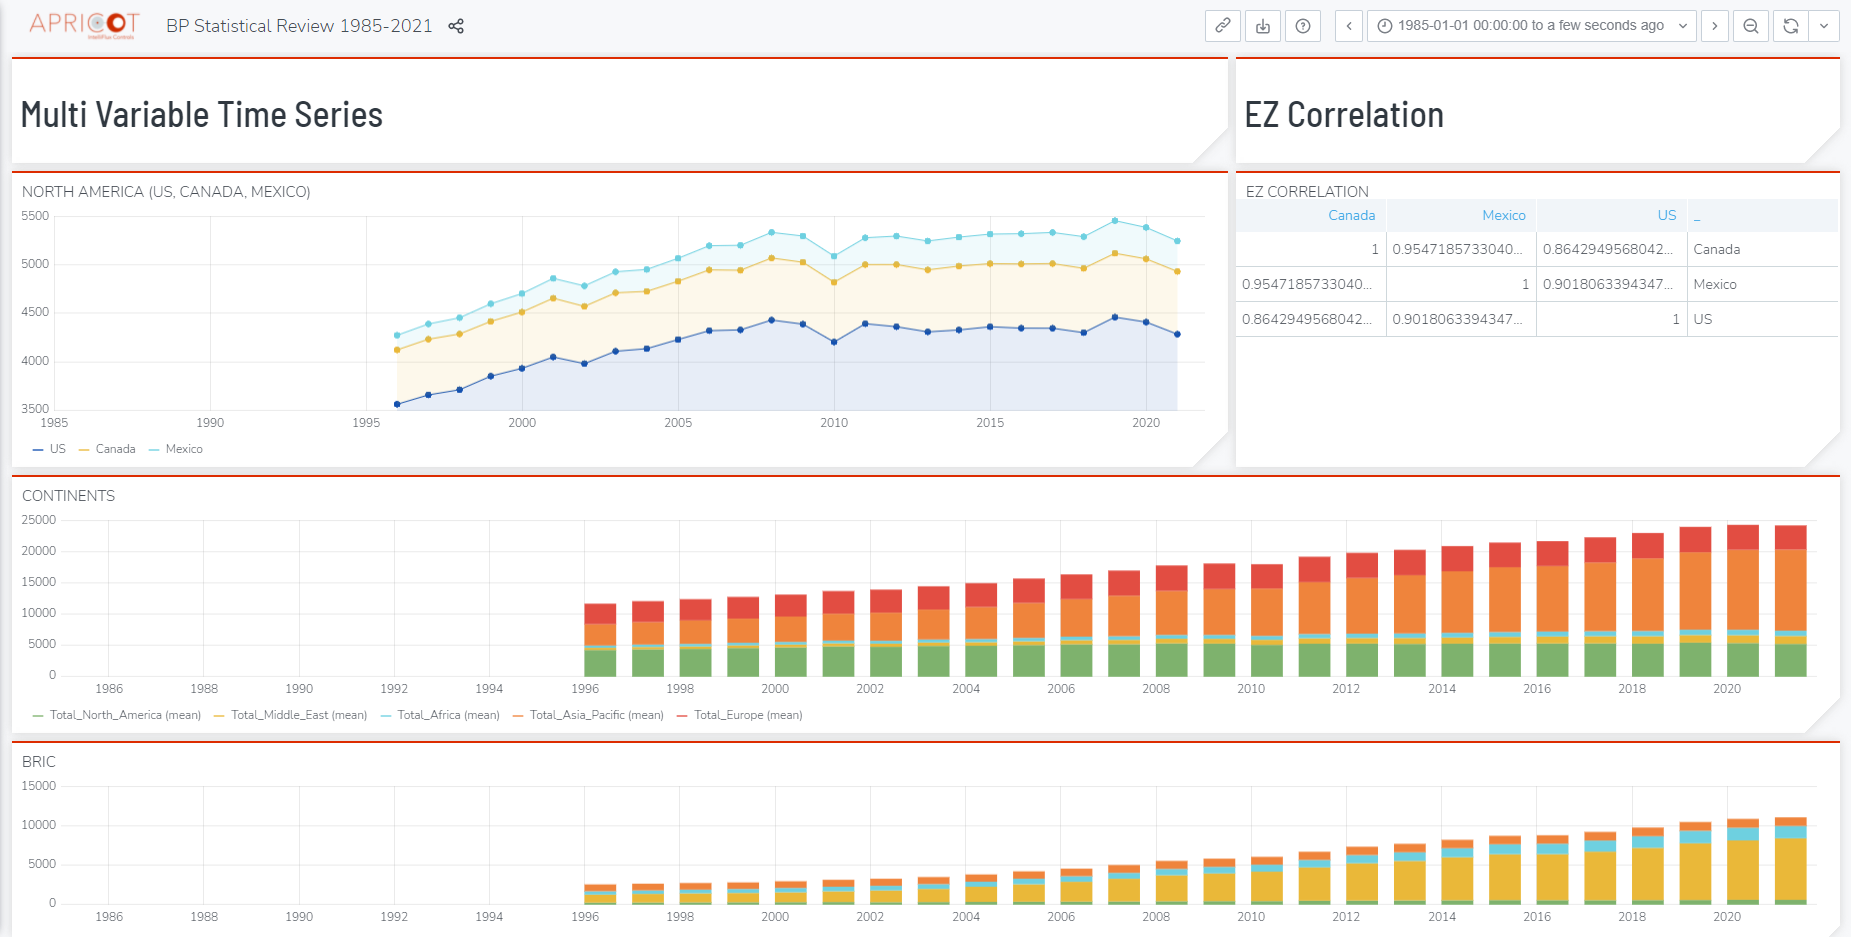
- Our APRICOT Portal works efficiently with multi variable time series. You can always show multiple variables within the same panel, and gain insights by applying functions like EZ correlation. By using APRICOT Assist, you will have access to more powerful functions.