
This dashboard shows a simple three-column operations dashboard for an Ultrafiltration system that does a great job of providing operational visibility and highlights a the use of an adaptive cleaning regimen. Click here to view the dashboard.
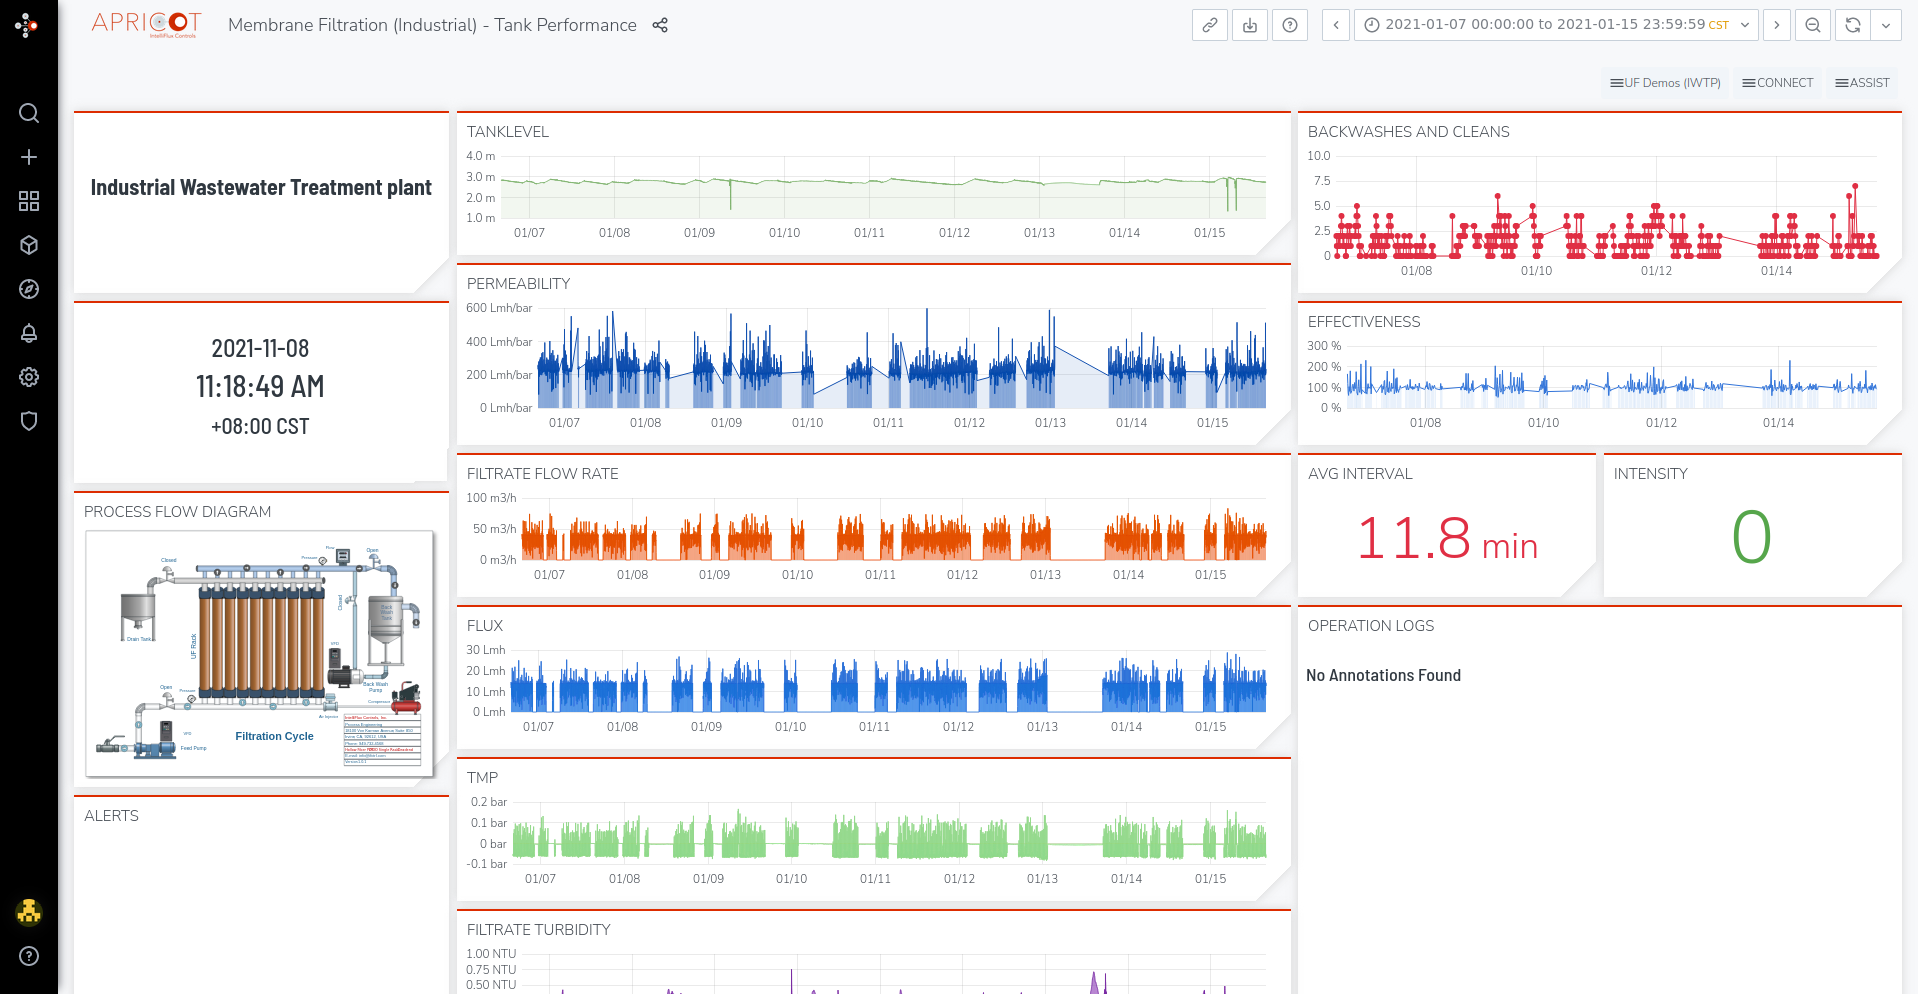
- The left hand column shows some information about the system and any recent alarms.
- The middle column shows trends of operational sensor data on a shared axis in separate plots.
- The right hand side is dedicated to cleaning statistics, and showcases the use of our dynamic Virtual Operator, part of the APRICOT Operate suite of tools. You can see how the cleaning intensity levels (top graph) are varied to maintain healthy flux and pressure readings.